A volunteer of ours is doing a massive do-over of the KLIK music library (one of the many tasks that people don’t think would ever need to be done), and at the same time we’ve decided it would be a good time to get rid of songs in the library that aren’t “high quality.”
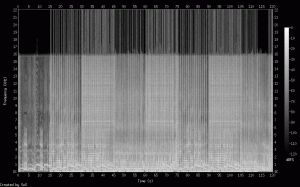
What exactly defines “high quality?” While usually this term is subjective based on of how much of an audio snob you are, there are some objective attributes that a “high quality” file will contain. Some may say “a higher bitrate file will naturally sound better, so there’s your objective basis.” This is not always true, though, as the audio may have sounded like garbage to begin with, and then encoded at 256kbps. For a concrete example, download this MP3 (deliberately encoded at 320kbps MP3 to try to minimize loss), and take a look at its subsequent spectrogram:
As you can see, there is a significant difference between the audio before 30 seconds compared to the audio after 30 seconds. They are the same 30-second clip of a song, but each is from a different source. The first 30 seconds was provided by a volunteer, in a file that was encoded at 192kbps MP3, and the second 30 seconds was provided by iTunes.
The version on the left is missing virtually all frequencies above 10,000 hertz. This causes the song to sound “dull.” You can hear it pretty clearly in the MP3 file above (although, you will probably not hear any difference on the standard iPod headphones — you will need nicer headphones to hear the full difference)
In short, there are a lot of songs in the library that would likely be considered “low quality.” Too quiet, missing frequencies above 10k hertz, etc.
Here is an example of a “good looking” Mp3 file (this is Lady Gaga’s “Born This Way”):

This particular file is a bit distorted, but nevertheless, it contains a much fuller frequency spectrum than the previous example.
So, here’s the problem. As mentioned before, “bitrate” is an allegedly “good measure” of sound quality. However, as we just showed, a high-bitrate file may still sound bad. We’ve decided it’d be best to give “spectral analysis” a shot.
Each of those spectrogram takes about 2-3 seconds to completely analyze a song. Span that over 15,000 songs, and that’s a pretty hefty chunk of time. How do we speed it up? There are two things we are doing:
- Converting stereo to mono for the spectrogram analysis (while the conversion from stereo to mono in itself takes time, the analysis of the data takes far less time)
- Analyzing only the first 120 seconds as supposed to the whole song.
These two things give us a pretty “clean” sample as to what the song looks like.
Since we’re not smart enough to simply write a program to generate the spectrogram but not display it, we’re relying on the coolest tool in the world called SoX to generate the spectrogram into PNG files. That means we all have to do is write a little program that analyzes PNG files.
Fortunately, the .NET Framework makes it pretty simple. It’s really just two lines of code:
Bitmap bmp = new Bitmap("C:\\Users\\Jake\\Desktop\\sox\\sox-14.3.1\\spectrogram.png"); Color clr = bmp.GetPixel(246, 272); |
Pretty spiffy, eh? Determining the pixel color is fast, and it’s even faster when we’re only dealing with grayscale. As such, we’ve configured SoX to create the spectrograms in grayscale, like so:
While we meek humans may not be able to tell much of a difference between grayscale colors, the averages that the computer calculates can tell a world of difference.
The first thing we did was establish the frequency range that we were most interested in having. After examining about 5 or 7 spectrogram, we decided the best area of interest was between 10,000 hertz and 16,000 hertz. Many files cut off after 16,000 files, much like this one. Files that did not extend into this range didn’t sound too great. As such, we found the X and Y bounds of this area across the whole PNG file.
Now that we had the pixels to analyze, the next step was to find the best “resolution.” It wound up being even reasonably fast to simply analyze every pixel and take the average of all of them to determine if the file would be admissible. It took about half a second per file to add up and average all these pixels (it’s about 75,294 pixels). However, skipping every other pixel increased performance even further. We ran a little test to see how many pixels we could skip per iteration and still get accurate results. This is what we came up with (with a different spectrogram, not listed here, that would fail the quality test [hence such low numbers]):
277 milliseconds to get a result of  45 (correct answer)
57  milliseconds to get a result of  45
23  milliseconds to get a result of  44
14  milliseconds to get a result of  46
9   milliseconds to get a result of  39
On each line, the delta value increased by 1. So, for instance, the 277 millisecond line was incrementing the count by 1 pixel on each iteration. The next line, 2 pixels, then 3 pixels, and so on. Adding 5 pixels at a time gave fairly inaccurate results, so we decided to go forward with 3 pixels, as it gave fairly accurate results and gives significant performance improvements.
Consider this: by even skipping every other pixel, you will get your results 55 minutes sooner than if you analyzed every pixel. There is even an 8 minute difference between skipping 2 pixels and 3 pixels. Overall, pretty incredible the resources that sampling will save.
Up next: how KLIK will be using statistical analysis to determine the best “average intensity of 10,000-16,000Khz threshold for musical quality!” (In other words, how we’ll use stats to figure out the minimum average of the intensity of sound between 10,000 and 16,000 hertz. Maybe that’ll make more sense).


Recent Comments